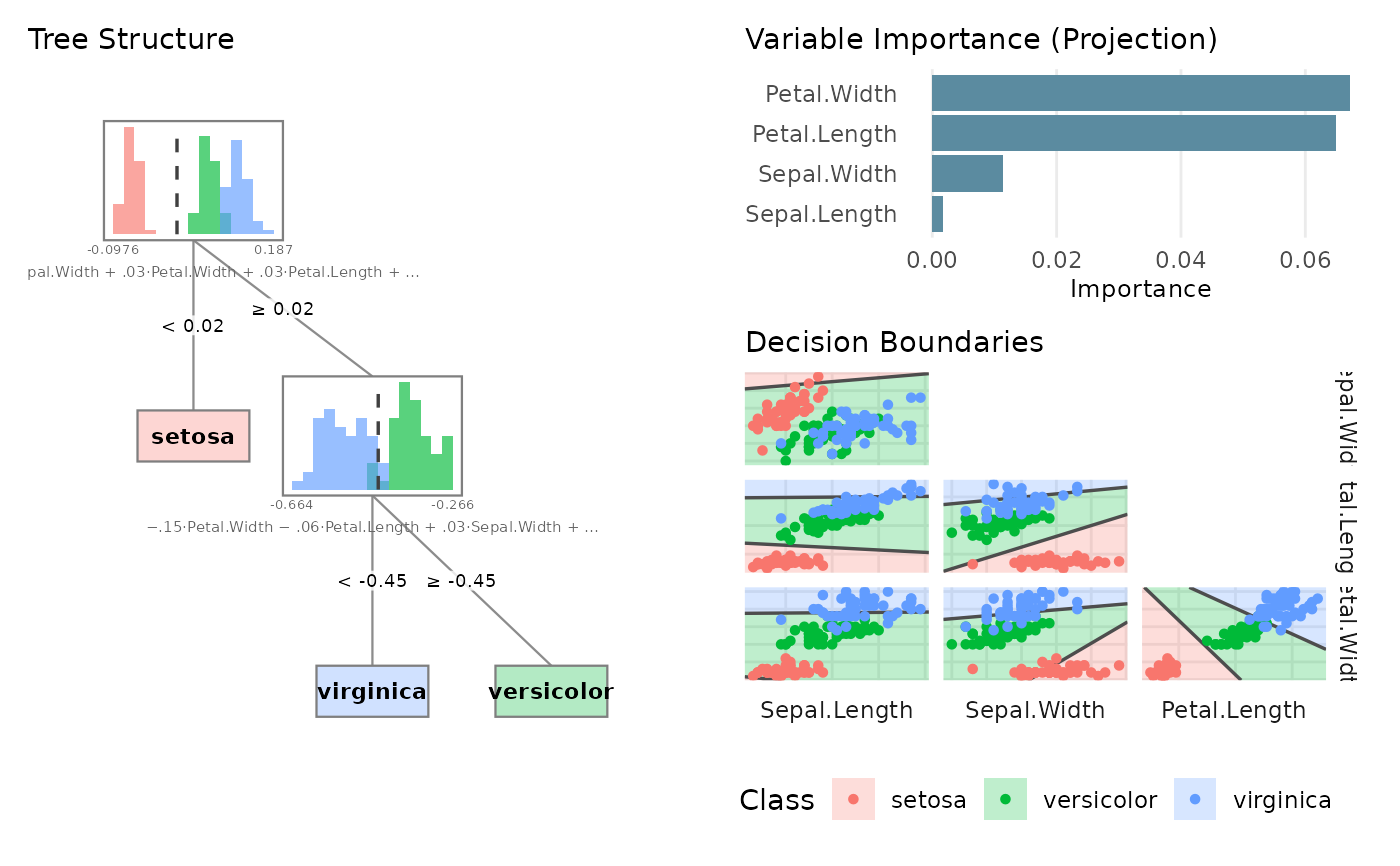
Plot a pptr model.
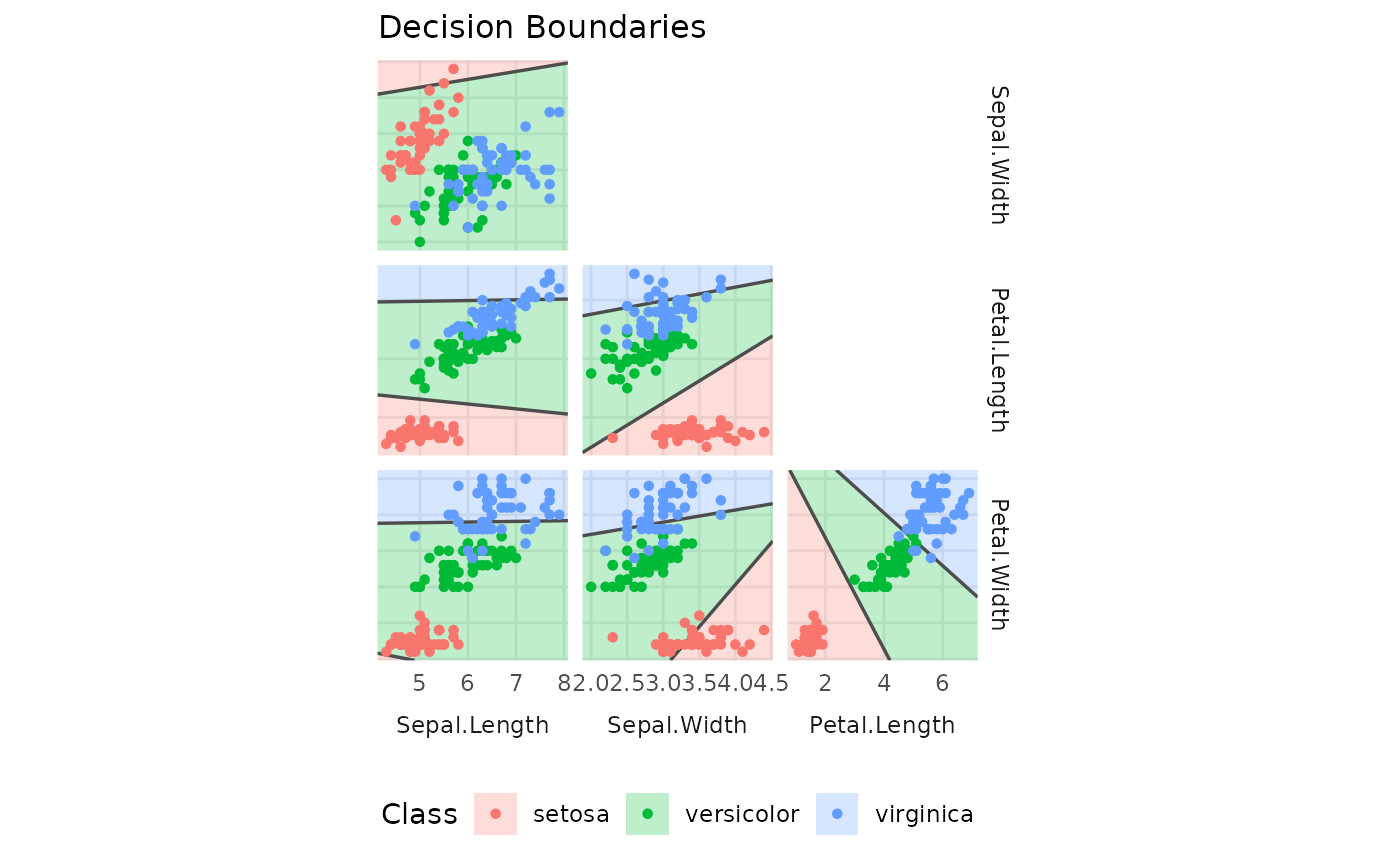
plot.pptr.RdVisualizes a pptr model. By default, shows a mosaic overview with tree
structure, decision boundaries, and variable importance. Use type
to show individual plots.
Usage
# S3 method for class 'pptr'
plot(x, type = NULL, metric = NULL, node = 1L, ...)
Arguments
- x
A pptr model.
- type
Character string specifying the plot type.
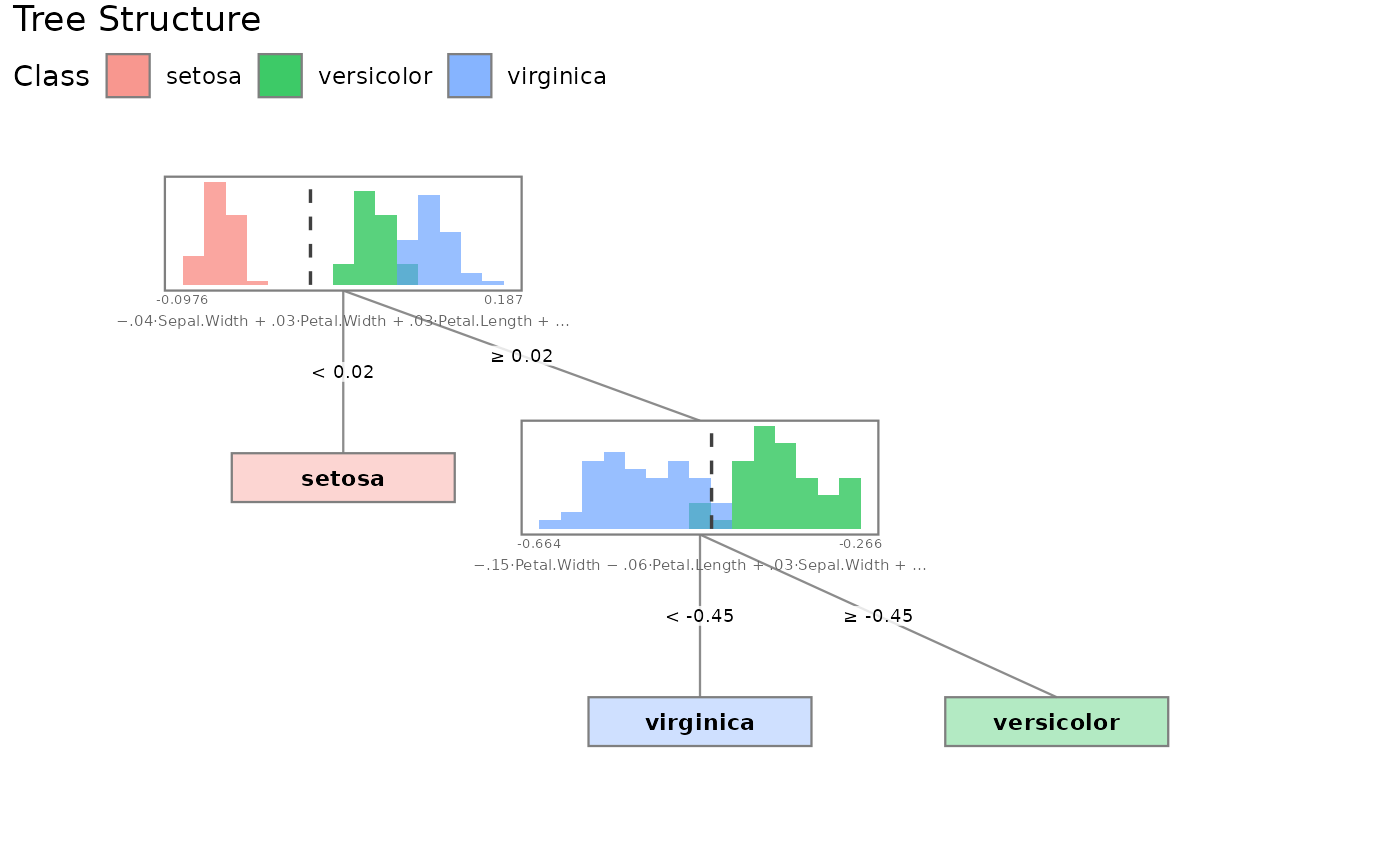
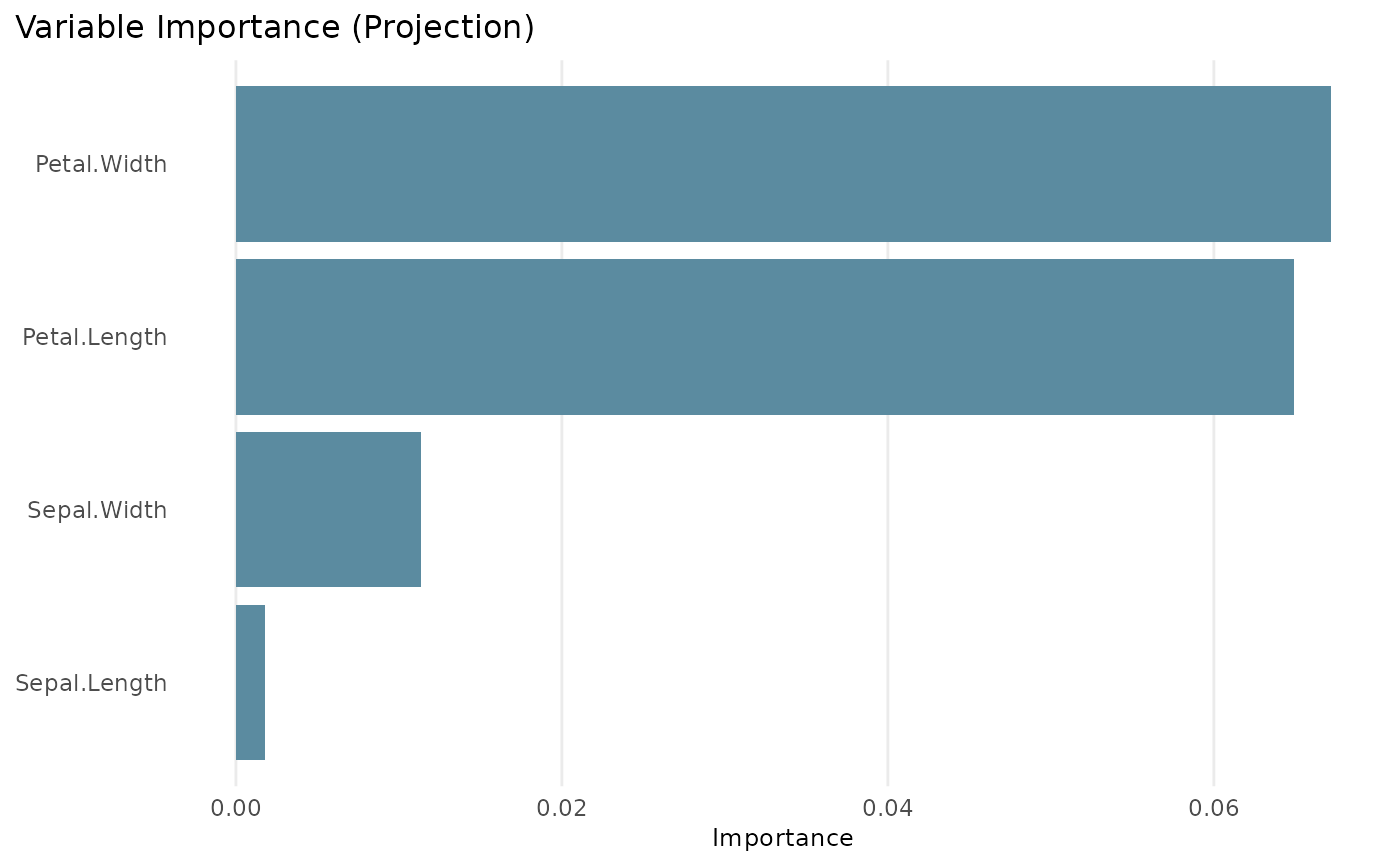
NULL(default) shows a mosaic overview. Other options:"structure"for tree with embedded histograms,"importance"for variable importance,"projection"for projected data at a node,"boundaries"for decision boundaries in feature space.- metric
Character string selecting a single importance metric to plot:
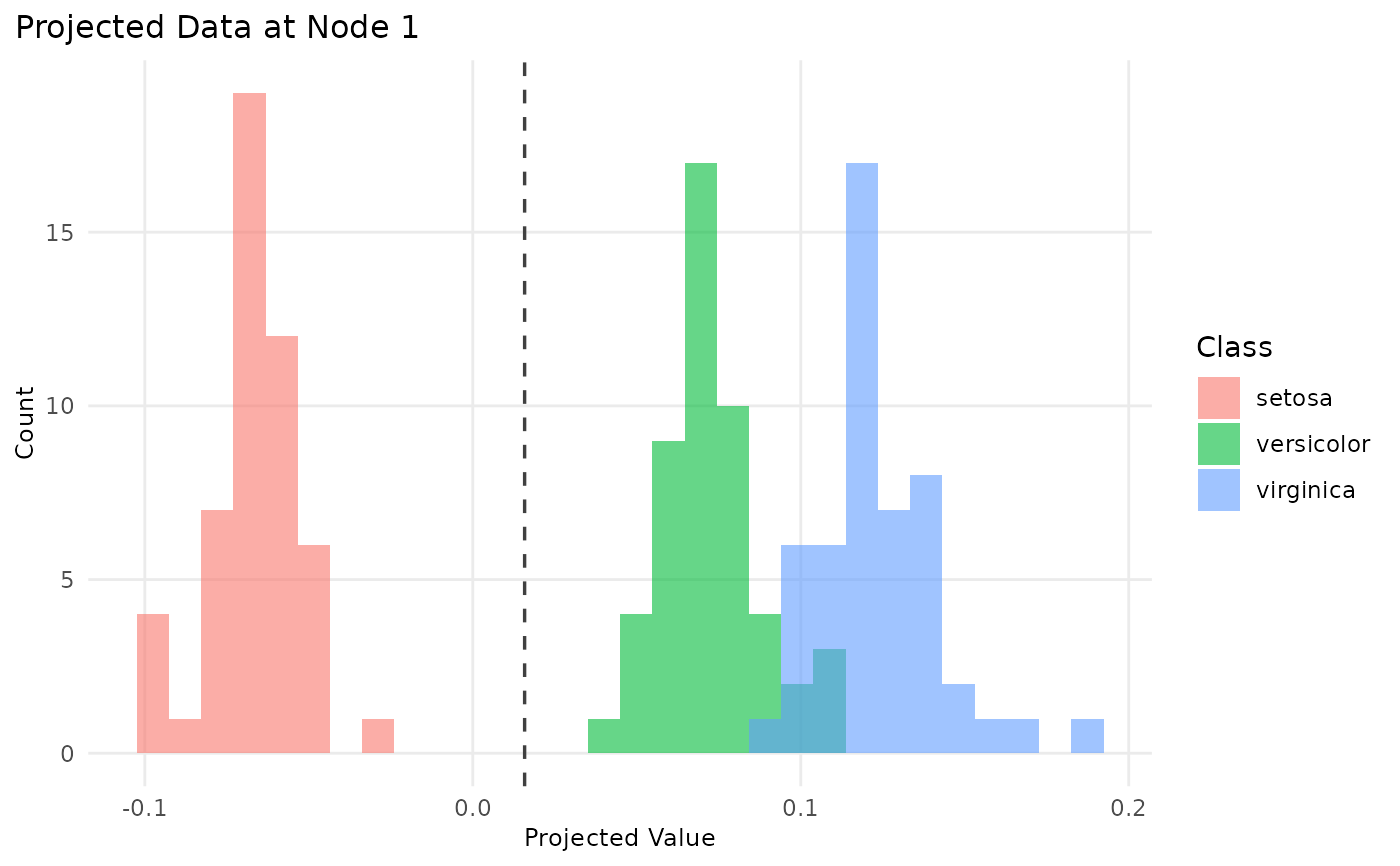
"projections","weighted", or"permuted"(availability depends on the model).NULL(default) shows all available metrics together. Only used whentype = "importance".- node
Integer index of the node for projection plots (1-based, breadth-first order). Defaults to 1 (root node). Only used when
type = "projection".- ...
Additional arguments passed to the internal plotting function.
Value
A ggplot2-compatible object (invisibly). The mosaic layout returns
a patchwork object that works with ggplot2::ggsave().
Examples
# \donttest{
if (requireNamespace("ggplot2", quietly = TRUE) &&
    requireNamespace("patchwork", quietly = TRUE)) {
  model <- pptr(Species ~ ., data = iris)
  plot(model)                         # mosaic overview
  plot(model, type = "structure")     # tree structure only
  plot(model, type = "importance")    # variable importance
  plot(model, type = "projection")    # projection histogram
  plot(model, type = "boundaries")    # decision boundaries
}


# }
# }